Visualize Model Training with TensorBoard
Visualizations can be helpful in allowing you to better understand, debug and optimize your models during training. By default, all models trained using PyText can be visualized using TensorBoard <https://www.tensorflow.org/guide/summaries_and_tensorboard>.
Here, we will explore how to visualize the model from the tutorial Train Intent-Slot model on ATIS Dataset.
1. Install TensorBoard visualization server
The TensorBoard web server is required to host your visualizations. To install it, run
$ pip install tensorboard
2. Verify TensorBoard events in current working directory
Complete the tutorial from Train Intent-Slot model on ATIS Dataset if you have not done so.
Once that is done, you should be able to see a TensorBoard events file in the working directory where you trained your model. The file path will be something like <WORKING_DIR>/runs/<DATETIME>_<MACHINE_NAME>/events.out.tfevents.<TIMESTAMP>.<MACHINE_NAME>.
3. Launch the visualization server
To launch the visualization server, run:
$ tensorboard --logdir=$EVENTS_FOLDER
$EVENTS_FOLDER is the folder containing the events file in 2., which is something like <WORKING_DIR>/runs/<DATETIME>_<MACHINE_NAME>.
Note: The TensorBoard web server might fail to run might fail to run if TensorFlow is not installed. This dependency is not ideal, but if you see ModuleNotFoundError: No module named ‘tensorflow’ when running the above command, you can install TensorFlow using:
$ pip install tensorflow
4. View your visualizations
After launching the visualization server, you can view your visualizations in a web browser at http://localhost:6006.
PyText visualizes the training metrics as scalars, test metrics as texts, and also the shape of the neural network architecture graph. Below are some screenshots of what you will see:
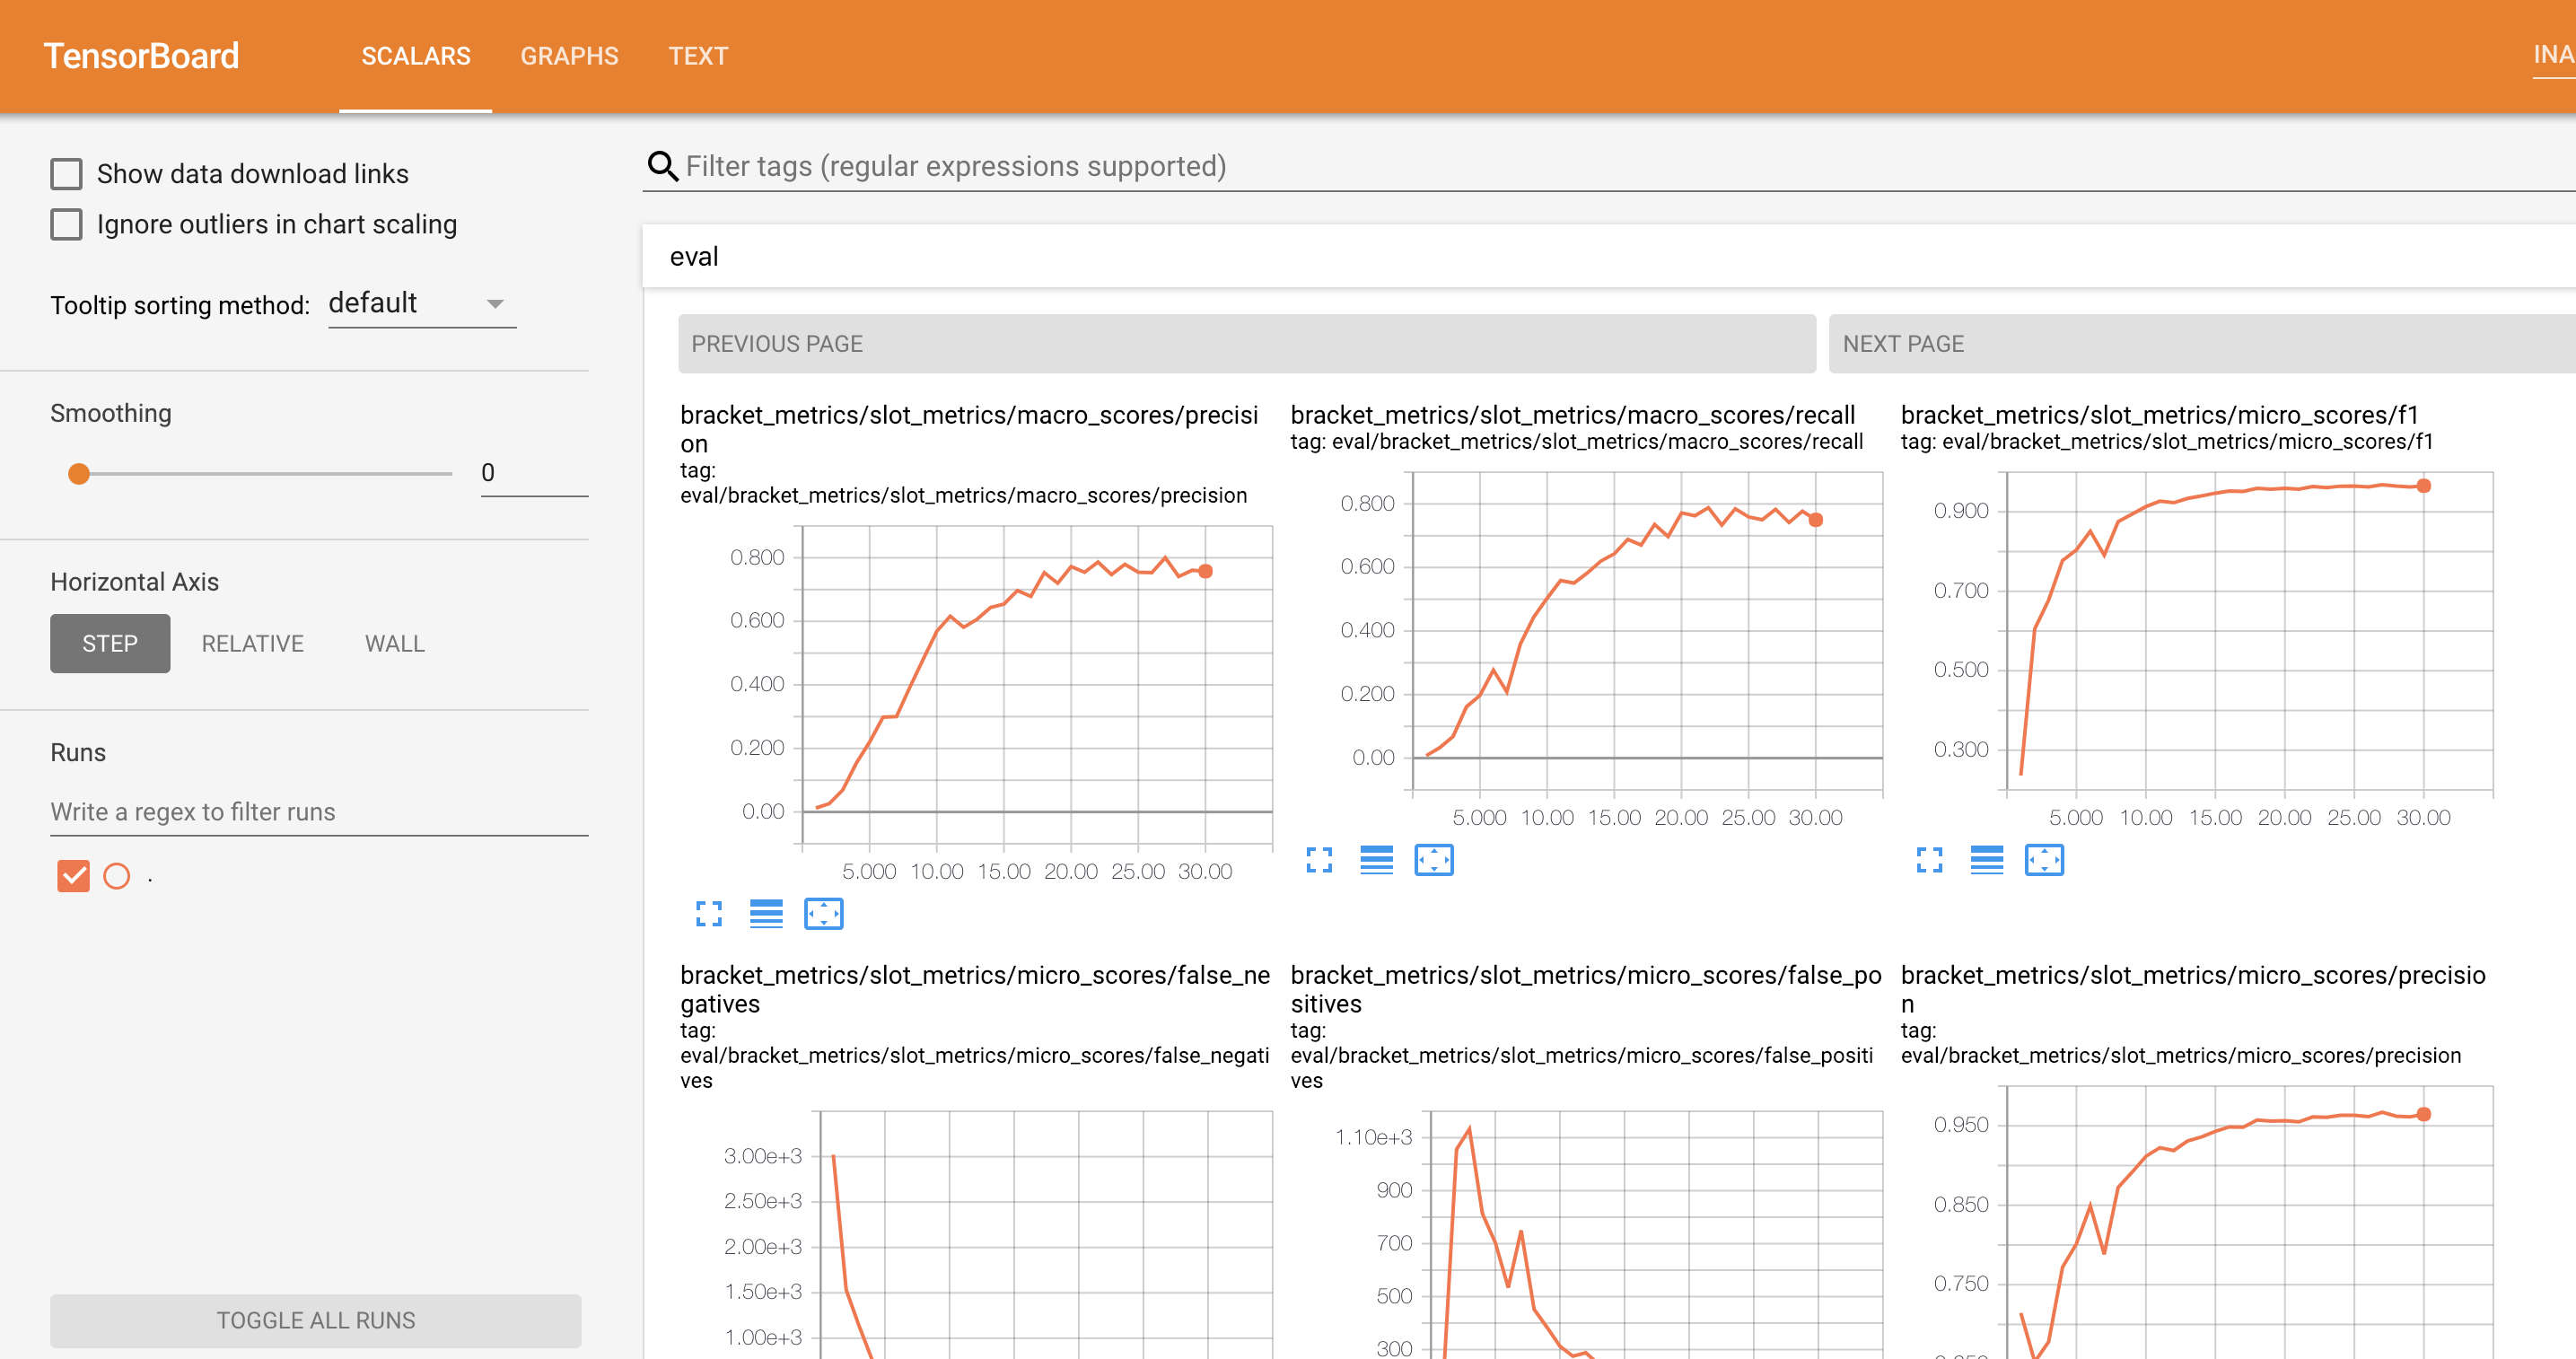
Training Metrics:
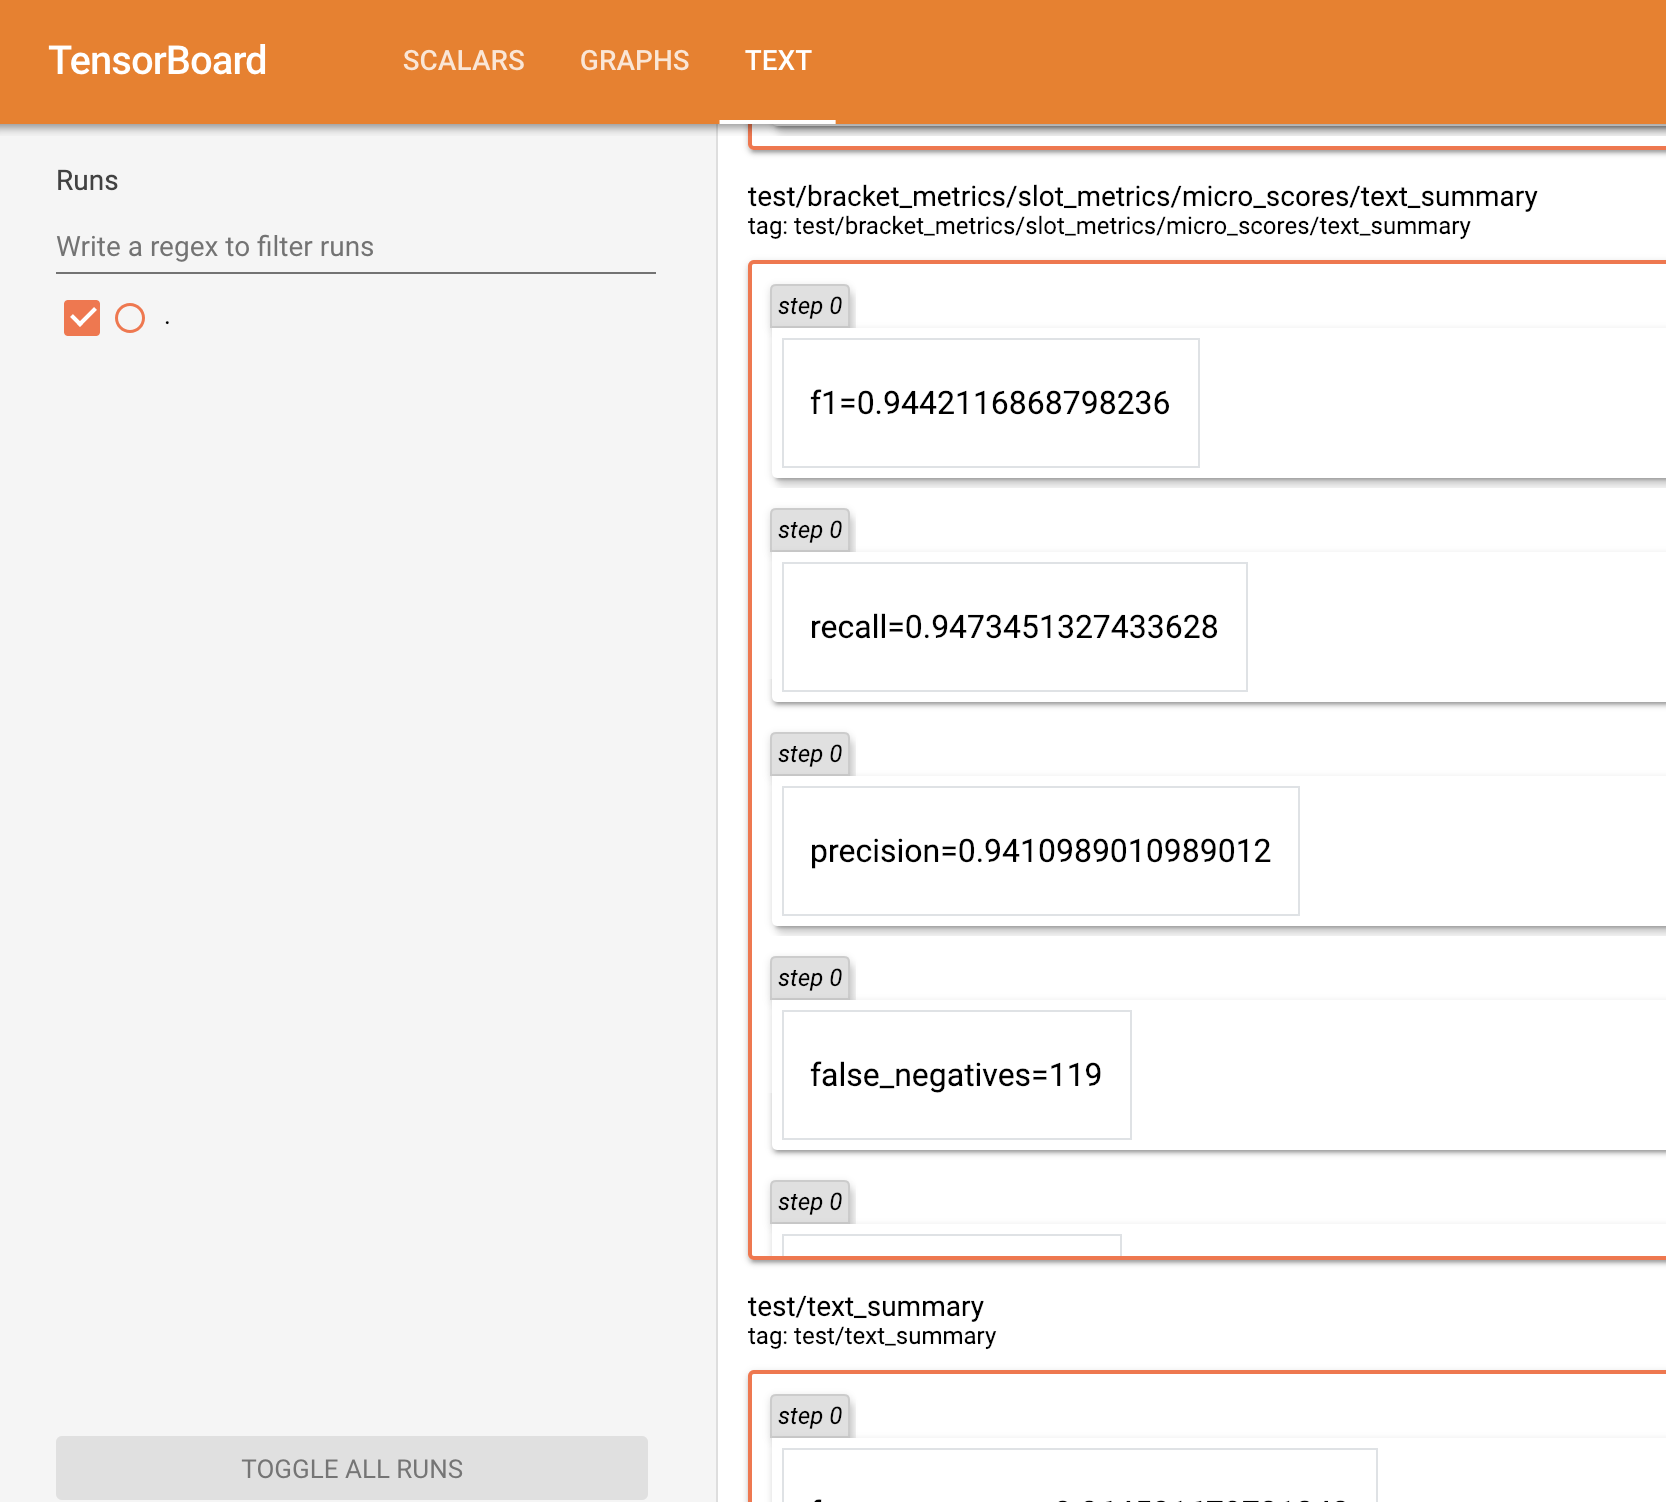
Test Metrics:
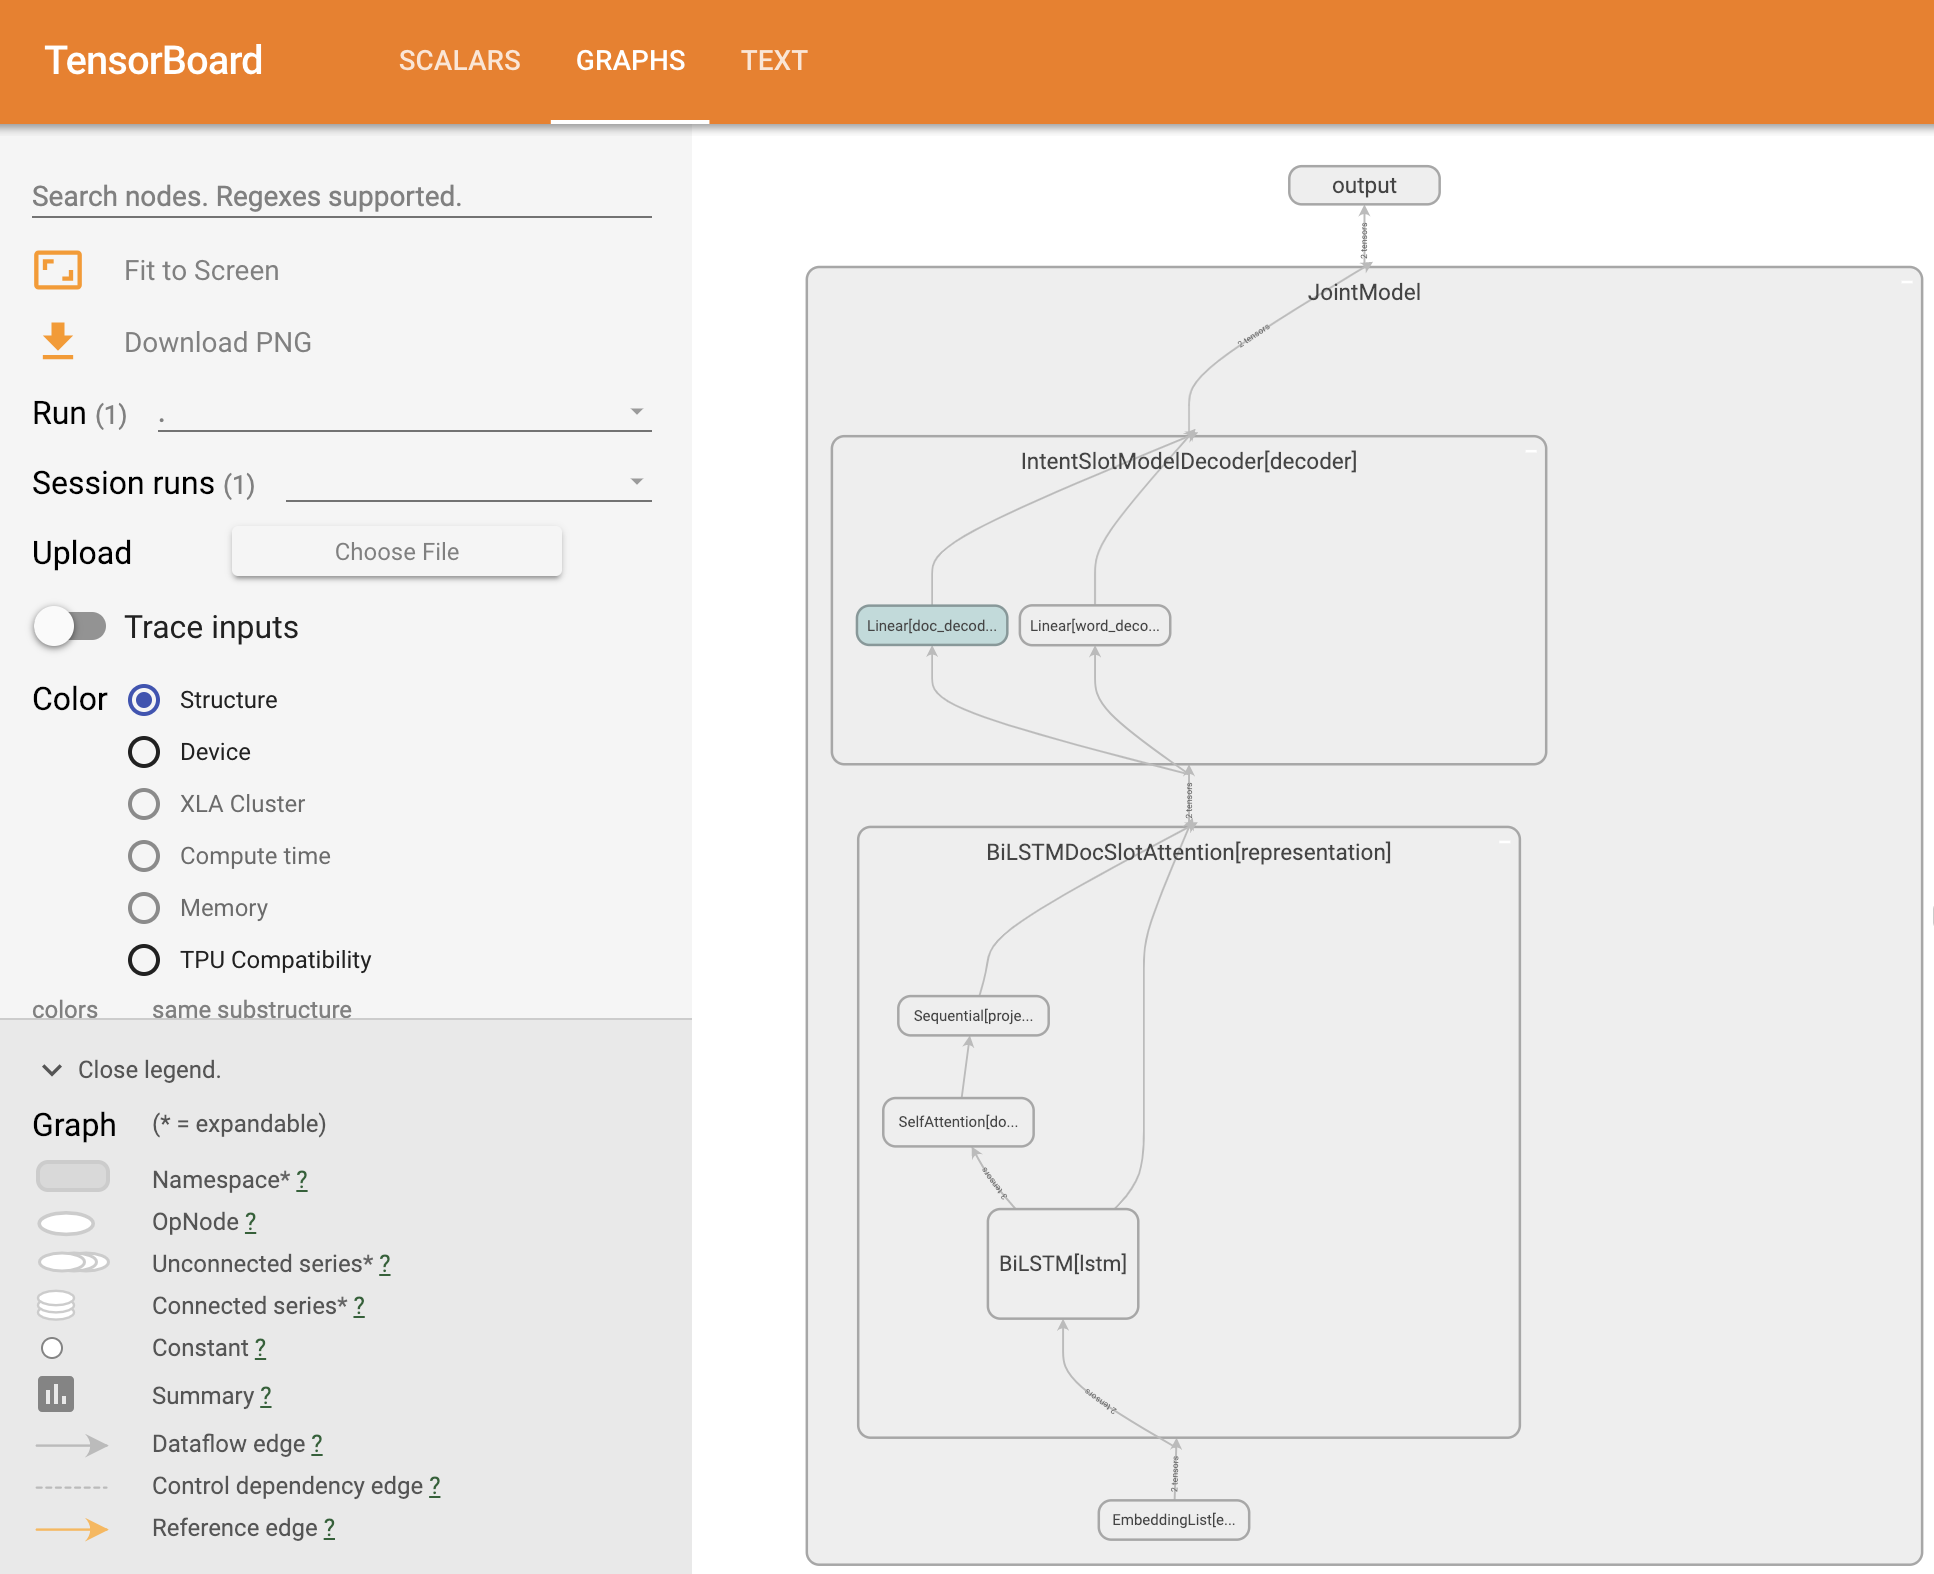
Model Graph: